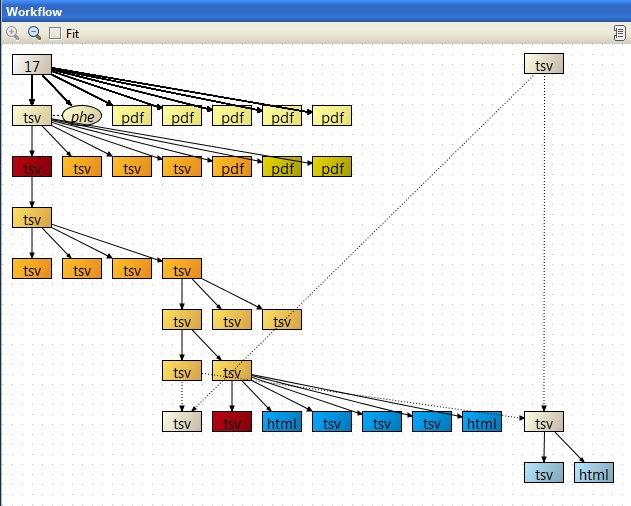
This session contains a case-control study comparing renal cell carcinoma samples with healthy tissue from the same patient. Data from 17 samples hybridized to Affymetrix U133A arrays were quality controlled and normalized using alternative probe mappings (altCDFs). Differentially expressed genes were analyzed with linear modelling taking into account also the gender of the patient, side of the kidney, and pairing of the samples. The significantly differentially expressed genes were compared to the original results by Lenburg et al and annotated. The up-regulated fraction was also analyzed for enrichment for ConsensusPathDB pathways and GO terms.
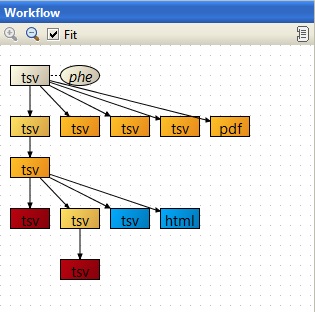
This session compares gene expression between European and African populations. Data from 120 samples hybridized to Illumina WG-6v1 arrays was normalized and quality controlled, and the differential gene expression was visualized using NMDS and PCA. Differentially expressed genes were detected using the empirical Bayes test, filtered for fold change, and analyzed for enrichment in GO categories.
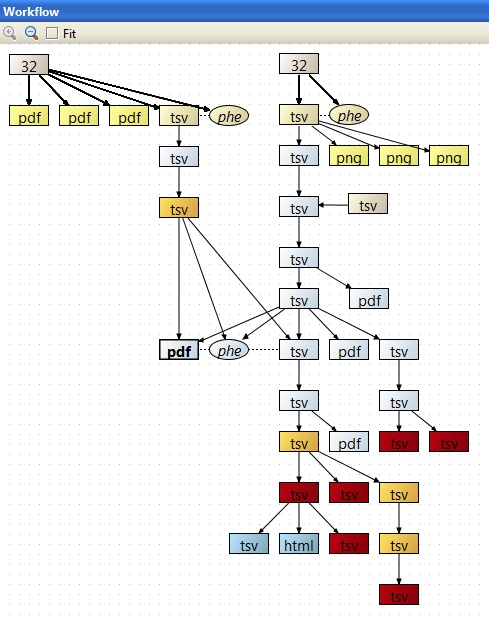
This session integrates aCGH and mRNA data from 32 breast cancer samples to study expression changes induced by DNA copy number aberrations. Copy number data from Agilent 4x44K arrays and gene expression data from Affymetrix U133A arrays was normalized, quality controlled, and mapped to chromosomal positions. After smoothing the aCGH data with a calibration dataset, the copy numbers were called, combined to regions, and compared to known copy number variations. The called data was matched with the expression data, and copy number induced expression changes were analyzed using a permutation based non-paramteric test. The results were filtered for p-value, analyzed for ErbB2 pathway involvement, and visualized using a DNA-mRNA plot.