Statistical testing using linear modelling and user-defined design matrices.
This linear modelling tool is based on the Bioconductor package limma. Statistical testing can be done either using a limma-kind of design matrix alone (if designed to account for coefficients), or using the design matrix and contrasts stating which coefficients are to be estimated. NOTE: As input you need to select both the expression value file and the design matrix file by holding down the Control key in the "Datasets" or "Workflow" panel.
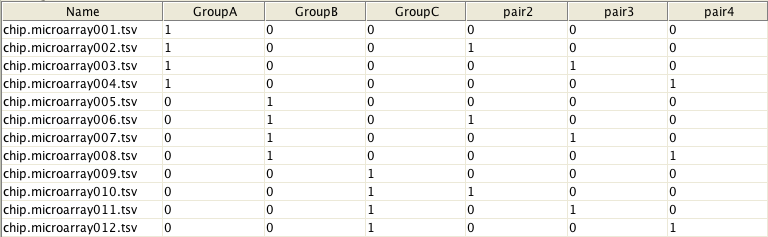
In order to use this tool, you need to create a design matrix of the experiment with rows corresponding to samples and columns corresponding to coefficients/sample classes to be estimated. For example, the matrix below shows that arrays from 1 to 4 belong to GroupA and arrays from 5 to 8 to GroupB, etc. In addition, it states that arrays #1, #5 and #9 as well as arrays #2, #6 and #10, etc form blocks, i.e. were from the same individual. Please note that when defining blocks, the design matrix should contain one block-group less than there are real groups. For more help about the how to make a design matrix, please consult the limma user-manual.
The contrast parameter constructs a contrast matrix corresponding to the specified contrasts of a set of parameters. For example, if your design matrix includes four groups (GroupA, GroupB, GroupC and GroupD), you may use the contrast parameter to restrict statistical testing to only include comparisons between GroupA and GroupB as well as between GroupC and GroupD. This is done by setting the parameter to GroupA-GroupB,GroupC-GroupD. Please note that levels defined here must match the coefficients/sample-classes given in the design matrix.
The parameter technical replication allows you to specify which samples are technical replicates (the same RNA hybridized on different chips), and it is treated in a special way in the linear models (using a mixed model). Information indicating which samples are technical replicates is read from the given phenodata column
A tab-delimited text file, "limma.tsv" table combines the p-values and fold changes results, together with the expression values and annotation information for the probes tested, in a convenient summary table that is suitable for further processing or analysis. In this table there are p-values for all contrasts for each of the main effects, the number and factor level being reflected in the column headers. For example, a column labeled "chip.p.adjusted.main13.tsv" refers to the comparison of level 3 to level 1 (the reference level) for the first (1) of the main effects. Same applies to the fold changes. When an effect has been setup to be treated as "factor" the fold change value is essentially the log2 of the ratio between the averaged expression values of samples for a particular factor level and the first (reference) factor level. In the case the effect is treated as "linear", the fold change values are actually an estimate of the slope of the linear regression fitted to the data.
Note that you usually want to pick the right p.adjusted -column from the result table for further analysis: if you for example are interested in the differences between the levels of the first main effect (usually in the “group” column in phenodata), you should sort and filter your table according to p.adjusted.main12 -column. (You can use Preprocessing / Filter using a column value tool for this.)
The Intercept is sort of a baseline: the expression level for that group for which all the main effects are on their reference level (marked with the smallest number in phenodata file). So the actual test is sort of superfluous: we are testing whether this baseline is in zero -whether this gene is expressed at all. Naturally this is not usually the case, and thus the p-values in the intercept column are usually very small. This is however rarely of any interest.
This tool uses Bioconductor package limma. Please cite the following articles:
Smyth, G. K. (2004). Linear models and empirical Bayes methods for assessing differential expression in microarray experiments. Statistical Applications in Ge- netics and Molecular Biology, Vol. 3, No. 1, Article 3.
Smyth, G. K., Michaud, J., and Scott, H. (2005). The use of within-array replicate spots for assessing differential expression in microarray experiments. Bioinformatics 21(9), 2067-2075.